Product Results
Assembly
The SlimLine will be used to store or transport a larger lunch box, and a smaller lunch box or (thermos) bottle. Since the lunch boxes are predefined (by Emsa), just as the bottom/drinking part of the bottle, only the bottle cap will be analysed for production. The production of the bottle cap is done by injection moulding and is therefore consisting of a material selection, a mold design and a simulation of injection molding.

Part Description
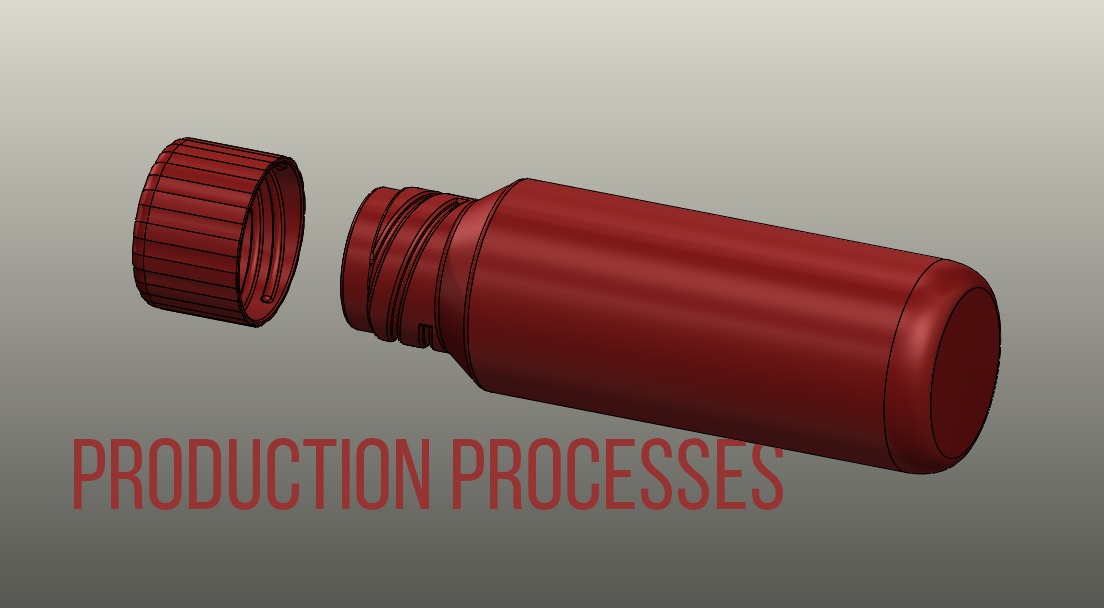
The slim line contains a cylindrical shaped thermos bottle. Its diameter is 50 mm, which is the width as the lunch boxes. This bottle has a cap which is also cylindrical, but with a diameter of 40 mm.
Both bottle and the cap have a wall thickness of around 2 mm. The bottle cap was chosen to be further elaborated. The bottle cap features three helical screw threads. Furthermore, the outside of the bottle contains several ripples for more grip. The inside contains an edge where a stainless steel plate can be inserted. This stainless steel plate reflects infrared heat so that the content stays warm. Between the stainless steel plate and the plastic, a rubber seal is inserted. At last, there’s a ripple on the inside of the cap to make sure that the cap stays fixed in its position.
A detailed version of the part description can be downloaded here.

Material Analysis Bottle Cap
It can be concluded that LCP is the best suitable material. This material is therefore chosen for the bottle cap. For alternatives, see the section Discussion below. LCP may also be referred to as Xydar or Vectra/Vectran, which are names used by companies more often. Besides the ranked material properties that are found to be best for LCP, LCP also has some additional beneficial properties. For example, the thermal expansion coefficient for LCP is considered rather low, which is beneficial for injection moulding, considering the shrinkage it would have when cooling down after injection moulding. It also has a rather high specific stiffness, which is beneficial for the product, since the dimensions are rather small and tolerances therefore too.
The material ranking in full detail, can be viewed in this excel sheet.
Discussion & Recommendation
First of all, the chosen material can be seen as expensive, or would not be easily producible for Emsa. In these cases, one has to find an alternative. In the following subsections you can read which materials can be seen as still suitable, but are less high-end performance, depending on what quality is considered the least important. Also solutions will be given to provide the product of a still reliable design.
Low-cost solution: PC or PMMA
LCP is a specialty polymer, which can be considered very expensive. A low-cost solution, while still having a reliable performance, would be a plastic consisting either PC or PMMA. The latter would have a slightly better performance, but slightly higher price.
More sustainable and eco-friendly solution: PPA-MD40
The top five of listed materials in the ranking are: LCP (unfilled), LCP (30\% mineral), PPA (40\% mineral), LCP (40\% mineral) and PEKK. Because these four have much better performance than the rest of the listed materials, these are implemented and compared at environmental impact.
Thus, if EoL potential will not be relevant in the case, PPA-MD40 will have the most sustainable life cycle (including production etc.).
Alternative design
An alternative design would be for example to use a coating (or e.g. a sealing ring) to reduce to (abrasive) wear and increase the lifetime. One could also be more precise in polishing the drinking part, but this would make again greater costs. When using the same ranking, and giving the hardness zero importance (i.e. a weight factor of 0), LCP would still be at the top. This solution would provide a higher amount of materials that got through screening.
Further down, you can read more about the other two parts of production.
Simulations
To ensure the cap of the bottle will withstand the loading conditions it can face during its lifespan, simulations were made. In total 5 simulations were made. The results can be found in the table at the bottom of this page. The used material for the cap is LCP, without extra infill materials. This material has a yield strength of 170 MPa. The largest stress reached in any of the simulations is 70 MPa. This leaves a large margin, which can account for remaining stress in the material from the production process.
Images of the simulation results have been included in the next paragraphs. These are made with varying deformation scales, which will be named. This means that the images should not be compared to each other. In the images the load and fixture vectors can be seen. Green vectors are fixture vectors, while purple vectors are the load vectors.

Compression
In this simulation, the bottlecap is compressed from the top. The load on the top of the bottle is 1000 Newton, evenly distributed over the top surface. The highest stress is reached in the center of this top surface. The deformation scale of this image is 17x.

Pulling on threads
This simulation is made to check the stress in the bottlecap when a vertical load is put on the threads. This corresponds to pulling on the bottle without turning the cap. The load on this part is 100N. The highest stresses are found in the wall, slightly below the top of the cap. This is an expected result, because this is the part with the smallest surface in the direction of the load. The deformation scale of this picture is 462x.

Hoop stress
For this simulation a outward load of 100N was put on the threads. The deformation scale is 865x.

Pinching
This is a simulation of pinching the bottlecap from two sides. It is only held on one side, to enable the cap to buckle outwards. The largest stress is found on the inside of the thread, opposite to the location of the load. This is because the thread is the thickest part of the bottlecap, which will experience the largest bending stress. The deformation scale for this simulation is 23x.

Torque on bottom
For this simulation a torque was applied to the bottom of the cap. This was a torque of 0.2 Nm, which is about twice as large as the normal torque for opening a unopened soda bottle. This torque should be much larger than the actual torque needed for opening this bottle, because it is not fixed in place as tight as a unopened bottle.
| Applied force (N) | Applied torque (Nm) | Max stress (MPa) | Max strain (um) | |
|---|---|---|---|---|
| Compression | 1000 | - | 70 | 3.52 |
| Pulling on threads | 100 | - | 14 | 0.65 |
| Hoop stress | 100 | - | 3.2 | 0.18 |
| Pinching | 100 | - | 27 | 1.45 |
| Torque bottom | - | 0.2 | 0.25 | 0.017 |
Mold Design
Since the bottle cap features three internal screws it is challenging to produce. There are two types of molds that can produce internal screws. One of them uses a rotating core and the other one uses a collapsible core. A collapsible core was chosen since more details can be molded and because it has a shorter cycle time.
A more detailed report of the mold design was made which can be downloaded here.

The core is produced by DME and retraction takes three seconds. The screw and other details are machined on the collapsible core.
To reduce the amount of excessive material, a hot runner system is used. To further improve cycle time, four cores will be producing caps simultaneously.

Moldflow analysis
A Moldflow analysis was performed to design the cooling system, runner system and to optimise the settings of the injection molding machine. The final design is shown in the figure. A more detailed report was made with all iteration inside Moldflow which can be downloaded here.
Results
Runner and cooling dimensions
When looking at the figure, the cooling system is placed low, because of the design of the mold. In the middle, there is a collapsible core. Thereby, the cooling system has to move and must be attached with hoses to the water supply. This is simulated by placing the end of the pipes as far away as possible form the parts, such that they are not influencing the cooling of the part. The hot runners are placed quite high, because there has to be room for the heating of the runners. Dimensions of the cooling and runner system are shown in table 1.
| Part | Dimensions |
|---|---|
| runner height | 52.5 cm |
| runner diameter | 5 mm |
| sprue diameter | 8 mm. |
| gate diameter (tapered end) | 4 mm |
| cooling diameter | 12 mm |
| room till top of cap | 12.6 mm |
| mold dimensions | 160-160-180 mm |
| Centre distance of front two caps | 80.01 mm |
Possible problems during and after molding
The material used in Moldflow is similar to the chosen material, but it is not the same. Thereby, the result could be different. This should be tested in real life. There are still some air traps and weld lines at the fillet on the top. This could give a weak spot on the bottle cap . Furthermore, due to the shrinkage, additional stresses are present in the part. The calculations on the strength of the product could be off. Also, the thicker wall at the filled, could result in problems during cooling. It is recommended to alter the thickness of the wall to have a more uniform wall thickness. This will also reduce warpage. The mold surface is simulated quite simple. The real mold will be more complicated. This could have an effect on the cooling of the product.
Conclusion
The optimisation is not yet done. It can take unlimited time and it is now time for a real life test. During testing, all results of the simulation software can be controlled and when necessary adapted to get better results. In the table 2 the relevant properties and settings on the machine are stated.
| Properties and settings | Value |
|---|---|
| Material | Vectra A625 |
| Injection time | 0.3 s |
| Melt temperature | 280 °C |
| Mold temperature | 63 °C |
| Coolant (water) temperature | 30 °C |
| Maximum pressure packing phase | 35.3 MPa |
| Maximum pressure filling phase | 45.57 MPa |
| Max clamping force during filling | 6.15 tonne |
| Max clamping force during packing | 36.12 tonne |
| Minimum shrinkage | 2.8 % |
| Maximum shrinkage | 4.3 % |
| Part weight | 13.2 g |
| Cycle time (3 seconds mold opening time) | 8.0 |
| Max deflection | 0.54 mm |